Salminen line generator
Line-length distribution
These settings change the graph.
Scales the number of lines in every bar.
Moves the peak.
Changes how sharply the counts drop after the peak. More negative values make the drop steeper.
Expected lines
Mean line length
Longest possible line
Lines longer than the mode
Sheet and lines
Edge contact: the share of lines that touch no edge, one edge, and two edges.
Shape frequency
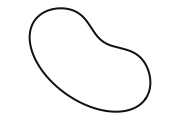
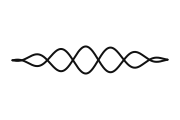
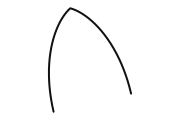
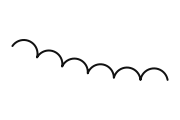
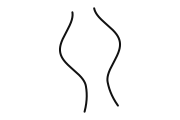
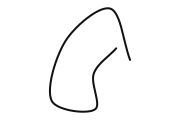
Curved shape types
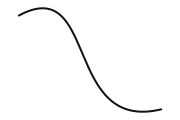
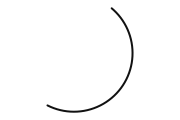
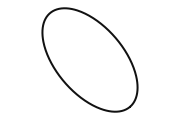
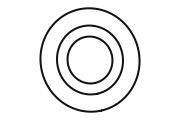
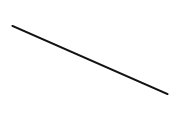
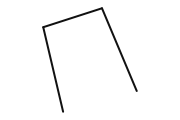
Straight shape types
Generate drawings
Each drawing uses its own seed: the starting seed for the first drawing, then the next numbers in order.
Shape samples
Three unclipped samples of each shape type. Black lines are curved, and blue lines are straight by the 1.5% test.